If you ask an investor if the stock market went as he or she thought it would in January and February, they would either answer “Yes”—or they would tell you the truth! The equity markets saw roller-coaster movements of historic proportions, and coming after a year of steady price increases and very low volatility, the swings in prices seemed even more dramatic.
The same might be said about the weather patterns in early 2018 (that really started in late December). The winter was moving along steadily, and for the first time in a few years, we were not terrified about the lack of heating degree days (HDD). Then suddenly, it got cold and it stayed cold. For close to three straight weeks there was no respite from the frigid temperatures. This was perhaps a dream of many oil dealers over the last few years, and then it came true.
Remember the adage “Be careful what you wish for”? Volumes were very healthy and wholesale prices stayed within acceptable ranges considering the weather and the price of crude oil. Supply outages were muted, and aside from some government officials needlessly stirring the pot, margins were solid.

Where we ran into trouble was a sharp increase in the number of run-outs and a dramatic increase in calls for both deliveries and equipment service. When you have customers waiting—sometimes for hours—to get through to a customer service representative (CSR), it does take some of the shine off of the good news the winter brought us.
While run-outs are part of the business, and usually considered “just a cost of doing business,” a lot of that logic goes out the window with the growing popularity and adoption of remote tank monitors (cheap promo alert: Go GREMLIN®!). Monitors not only address most issues related to run-outs, but—perhaps more importantly—they also help prevent the other delivery type that frustrates owners, drivers and dispatchers: tiny deliveries. Imagine dispatching a truck to a customer’s house on January 3, expecting to deliver close to 200 gallons (hopefully not more) and then having the whistle go off after only 35 gallons because the customer has been in Florida since Thanksgiving and turned the thermostat down to 50°F to keep the pipes from freezing (not fun).
However, the challenges were not limited to just run-outs and small deliveries. While those delivery challenges represented a higher percentage of deliveries than usual, and led to a sentiment I never thought I would hear in January (“I just need a couple of warm days so I can catch up”), there were two root causes. One was somewhat predictable and preventable; the other, less predictable and possibly preventable.
A good deal of the calls to dealers, tying up CSRs and phone lines for hours, were “panic calls” from customers who were scared that they might run out of oil. After all, it had been cold for two straight weeks, they had a friend who ran out of oil, the forecast was for temperatures below 0°F and mistruths were circulating about oil companies and how they need to be watched carefully, lest the consumer gets ripped off. These reasons, in the aggregate, led to a mini-hysteria with customers, who were not due for a delivery, calling and demanding a delivery—of even only 50 or 75 gallons. What’s a dealer to do? The dealers interfered with their dispatching and K-Factor systems and made the inefficient deliveries. Here is a great place for another plug for tank monitors (not only as run-out protection), but you get the point.
The other reason for more calls than usual was an uptick in the number of equipment-related service calls. They ranged from “the house wouldn’t/couldn’t get above 52°F” (maybe because of mis-sized equipment, poor insulation or new French doors without a good seal), to the failure of a single part, to total equipment failure. One theory for this big jump in service calls in the winter (after all, heating equipment is supposed to work during the winter, right?) is that after two very mild winters, a lot of equipment problems that normally would have occurred during those winters simply didn’t due to the mild weather. In other words, Mother Nature kicked the can down the road, and the stress on the physical systems was just too much, and it gave out—all at once.
This “theory,” which I have run by a few of my industry expert friends, is mostly accepted, but far from proven. Can you prove why equipment failed more in a certain time period with certain elements, over a different time period with different elements? The easy answer would be no, but those of you who regularly read this column are aware that we have access to virtually unlimited data in today’s heating oil distribution world, and access to world class processing power (thanks to Moore’s Law and the like). We are attempting to build a model that will actually lead to a set of predictive models to notify dealers about certain sets of customers (or types of equipment), based on a number of variables, such as HDDs, age of equipment, maintenance history, price of oil, size of deliveries and dozens more that are more likely to experience problems and lead to “no heat calls”. If the data can help to predict retention and attrition, which it can, we believe that the data can better predict service issues (not with absolute certainty, but give you better “guesses”). If we can prove that, it can make a very big difference in pre-season maintenance, in staffing during cold snaps, in pricing of service contracts and in a few other things that we are discussing with our clients.
More to follow. It’s been a great season—one we have needed for a long time! ICM
 People sometimes get bothered when shown a better way to do things. What those people often infer from the suggestion of improvement is that it is also a condemnation of how they currently do things. Although the title of the article is a bit tongue in cheek, Eight Track tapes were the best way to listen to music. Then, cassette tapes replaced them, followed by CDs and now digital satellite radio. At any point, there was a “best” and the best was good enough for a while, but then there was something better.
In our industry, there are many examples of things that were the best at one point in time, only to be replaced (or supplemented) by something even better. Mailed newsletters were great (and for some demographics still are great), but most successful marketers have some digital presence in their marketing plans. K-Factors were an excellent way to make an educated guess as to the amount of fuel in a customer’s tank, but a remote monitor will always be a better way to know what is in a tank—and to make more efficient/profitable deliveries.
The same can be said about hedging for oil dealers. Over the past 20 years, we have seen a good deal of improvement in the way that most dealers hedge their risk, but although many are practicing with the best tools available, perhaps it is time to bridge the gap between “what is” and “what could be” with regards to managing risk.
The notion of hedging is still the same as it has always been: to transfer the risk that you have, related to the sale of oil to your customers, to someone else willing to assume that risk. Transferring the risk, generally the price risk, allows dealers to more efficiently compete and grow by controlling margins for fixed and capped offers, as well as managing the cost of inventory in storage or wetbarrels to be purchased at a time in the future.
Although contracts are generally in full 42,000 gallon (1,000 barrel) increments, there are ways to customize hedges down to the actual needed volume. Today, and for the last number of years, you can match your price risk (in the case of a cap, your risk might be that prices would increase, raising your cost of oil and cutting into, or eliminating, your profit margin) against the volume that you plan to sell each day/month/season. It sounds like a pretty envious position to be in for a dealer—transferring both price risk and volume risk. It actually has been a “best practice” for a while, but we have been wondering if this is all that can be done.
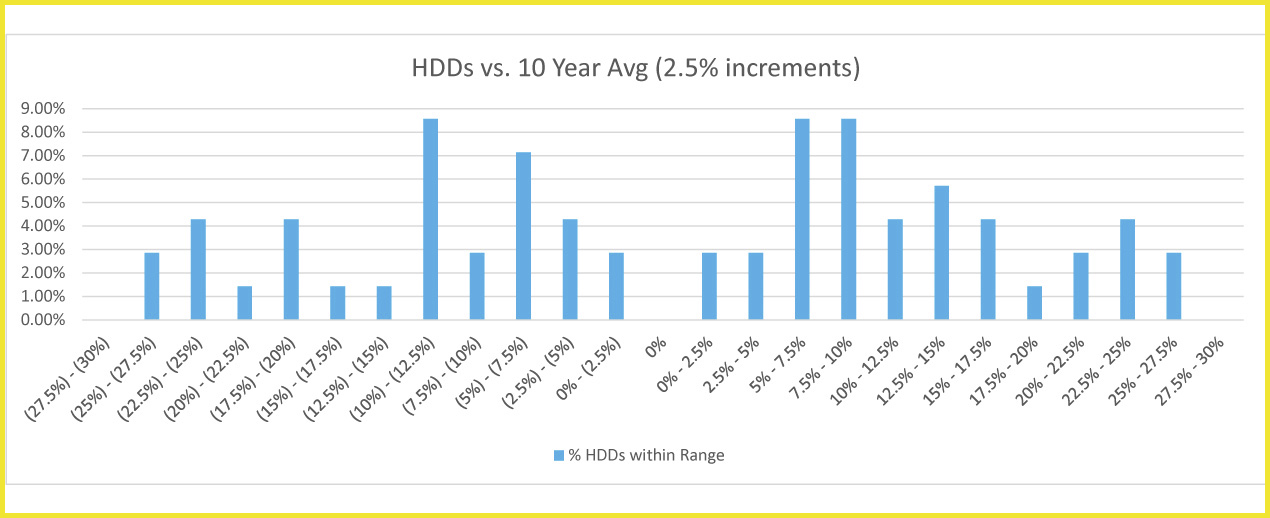
In a typical example, a dealer might assume that he or she will sell 22% of their annual volume in the month of January. That assumption is based upon historical heating degree-days, and the specific delivery history to the customer base. On average, indeed, 22% of the volume is delivered in the month of January. However, it is rarely exactly 22% of the delivered volume! Sure, January is a cold winter month, but sometimes it is only a little cold (say 20% warmer than an average January—like we have seen a couple of times lately), and sometimes it can be much colder—say, 20% colder than average. In actuality, it is rarely average—and that led us to realize that “average” and “normal” are not the same thing.
This chart shows the distribution of actual Heating Degree-days (HDD) as compared with the 10-year average for each month over the past 10 years (70 data points = seven months times 10 years). As you can see, the actual monthly HDDs are all over the place, with very few actually close to the average.
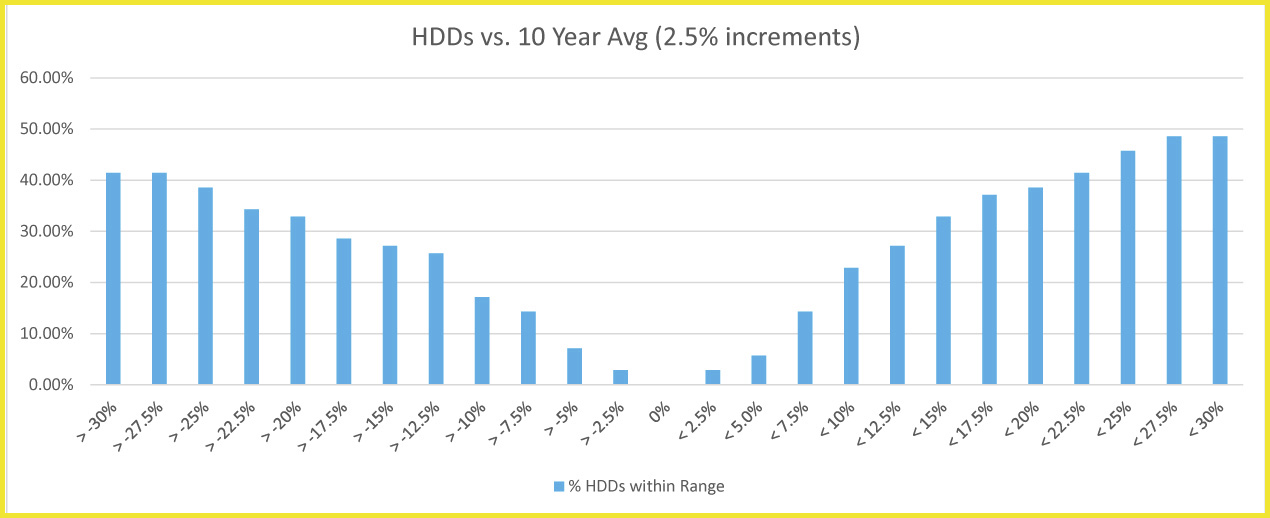
This chart shows how wide you need to go to truly capture what would be deemed to be “normal.” As you can see, 80% of months are between 80% and 120% of average, whereas 88% of months are more than 5% higher or 5% lower than the average. In other words, hedging with “average” volume is almost always going to leave you with either not enough gallons hedged or too many gallons hedged.
When you don’t have enough gallons hedged (due to cold weather), and prices rise (as there is a good correlation between weather and price), you are likely buying those needed gallons at a rising price.* On the other hand, if it is warm and you are “over hedged,” those gallons are more than likely at a falling price* and you will have to sell them into the marketplace.
We feel that it is time that dealers look to limit the volumetric exposure that is inherent, and, as the charts show, are very regular. By looking to further customize either swaps or options to match not only the price risk (strike price or swap/futures price), but also matching the volume with that actual weather—not the historical average weather—another layer of uncertainty can be transferred (hedged) to a trading partner who is willing to assume that risk.
Think about the months when it got cold and you simply didn’t have enough hedged gallons to match your delivery obligations. Or, perhaps even worse, what about the warm months that leave you sitting with gallons that not only don’t you have a need for, but you also have financial exposure—such as with a fixed price offering or with gallons in storage.
There is not enough space (and, I prefer that my readers don’t fall asleep) to go into the details of how to better hedge volume in addition to price, but the complexities are not that great, and the cost benefits might be enough to make you wonder why this article hadn’t been written before. Settling your trades against a predetermined volume is a very good way to hedge, and given the way that the industry moves, it may be considered a very appropriate way to do so. Settling your trades against something—the actual weather— that more closely matches up against your deliveries may soon become the best practice.
PAST RESULTS ARE NOT NECESSARILY INDICATIVE OF FUTURE RESULTS. The risk of loss in trading commodity interests can be substantial. You should therefore carefully consider whether such trading is suitable for you in light of your financial condition. In considering whether to trade or to authorize someone else to trade for you, you should be aware that you could lose all or substantially all of your investment and may be liable for amounts well above your initial investment.
*Please note that we are not opining on whether the weather and price will follow each other. They might and they might not. There are strong historical correlations, but our main purpose with this type of trade is simply to match risk volumes with hedged volumes.